When you place a market order to buy Bitcoin, you might expect to get it at the current price. But what if the price jumps 5% before your order fills? That’s not a glitch-it’s a lack of liquidity. And the tool that shows you why this happens? Order book depth.
Order book depth isn’t just a chart with bars. It’s a live snapshot of buy and sell orders stacked up around the current price. Think of it like a crowd at a concert. If thousands of people are ready to buy tickets at $50, and only a few are selling, the price won’t move much when someone buys. But if only five people are willing to sell at $50, and a hundred want in? Price shoots up. That’s what order book depth reveals in real time.
What Is Order Book Depth?
Order book depth is the total volume of buy and sell orders at every price level near the current market price. It’s not about how much Bitcoin traded yesterday-it’s about what’s waiting to trade right now. On Binance or Coinbase, you’ll see this as a vertical bar chart on the side of the price chart. Green bars show buy orders (bids). Red bars show sell orders (asks). The height of each bar tells you how much of the asset is available at that price.
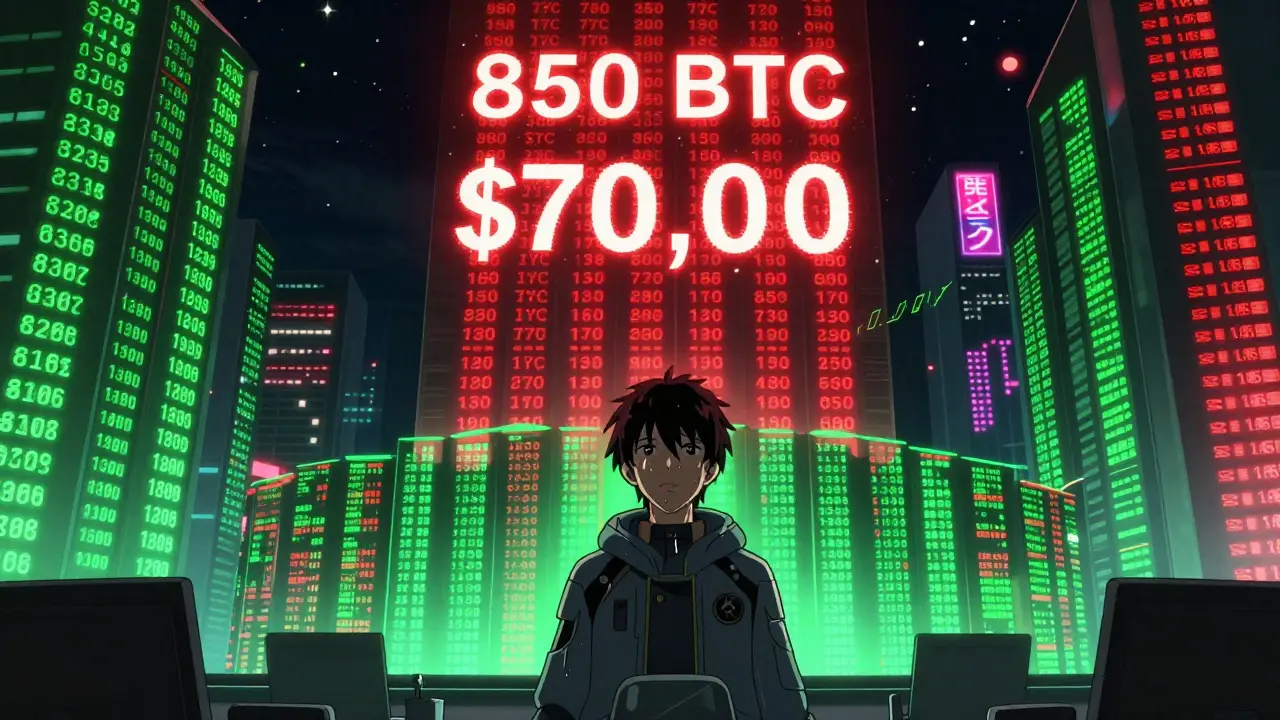
For example, if the Bitcoin price is $70,000, the depth chart might show:
- $69,950: 1,200 BTC in buy orders
- $70,000: 850 BTC in sell orders
- $70,050: 300 BTC in sell orders
This means if you hit market buy right now, you’ll get 850 BTC at $70,000, then another 300 BTC at $70,050. The rest? You’ll pay even more. That’s slippage. And depth tells you exactly how bad it will be.
Why Liquidity Matters More Than Price
Most traders watch price alone. They think a rising chart means buying pressure. But price can be manipulated. A whale can dump 100 BTC at $70,000, then instantly buy it back at $69,950-making it look like demand is strong. Without depth, you’re blind.
Liquidity is the real measure of market health. A deep order book means big orders can be filled without moving the price. A shallow one? Even a $50,000 trade can spike the price 10%. In 2024, Bitcoin’s average 1% depth across major exchanges hit $214 million. That’s up from $18.7 million in 2020. That’s why Bitcoin’s volatility dropped from 89% to 47% in the same period. More depth = smoother price movement.
Compare two altcoins:
- Coin A: $5 million in buy orders within 1% of price. A $1 million market buy? Price barely moves.
- Coin B: $500,000 in buy orders within 1% of price. Same $1 million buy? Price jumps 15%.
One looks like a solid asset. The other? A trap. Depth tells you which is which.
How to Read Depth Charts
Depth charts aren’t hard to read-but most people misinterpret them. Here’s how to do it right:
- Look at the spread: The gap between the highest bid and lowest ask. A narrow spread (like $70,000 bid / $70,005 ask) means tight liquidity. A wide spread (say, $69,900 / $70,100) means thin market.
- Check volume at key levels: Is there a wall of buy orders at $69,800? That’s support. A tall wall of sells at $70,200? That’s resistance. These levels aren’t random-they’re where big players are hiding their orders.
- Watch for imbalance: If buy volume is 3x higher than sell volume within 0.5% of price, it’s a strong signal buyers are ready to absorb supply. If sells dominate? Sellers are in control.
- Use percentage depth: Most platforms let you toggle between 0.1%, 0.5%, and 1% depth. For retail traders, 1% is enough. Professionals use 0.1% to execute large orders without moving the market.
Pro tip: Don’t just look at the numbers. Look at the shape. A smooth, wide depth profile? Healthy. A jagged, uneven one? Watch out. That’s often where spoofing happens.
Spotting Spoofing and Fake Liquidity
Not all depth is real. Smart traders (and bots) place huge orders to scare others-then cancel them before they’re filled. This is called spoofing. It’s illegal on regulated exchanges, but still common in crypto.
How to spot it?
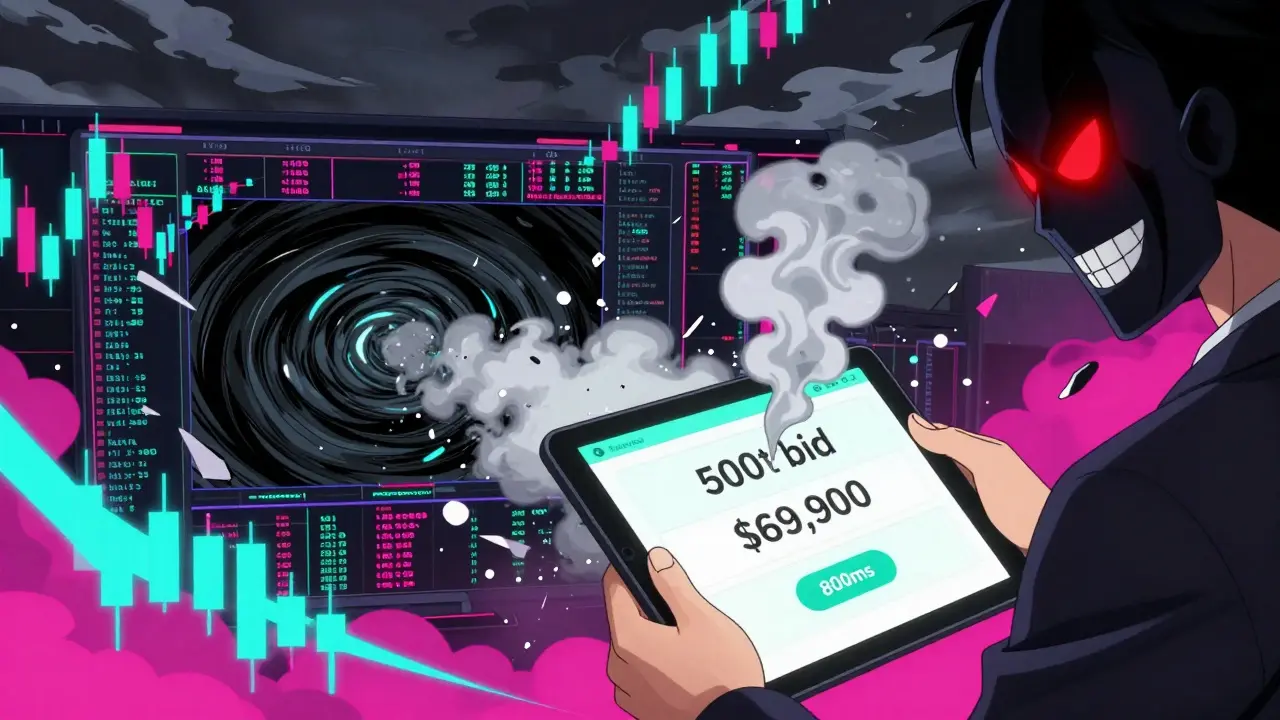
- Orders that vanish: You see a 500 BTC bid at $69,900. You place your buy. The bid disappears. That’s spoofing.
- One-sided depth: Massive buy orders on one side, but zero sell orders on the other. That’s a trap.
- Too perfect: A wall of 1,000 BTC at exactly $69,999.99? Unlikely. Real liquidity is messy. It’s spread across multiple price points.
According to Bookmap’s 2024 data, spoofed orders typically disappear within 800 milliseconds. If you’re using a free platform with 1-second refresh rates, you’ll never see it happen. That’s why professional traders pay for tools like Bookmap Pro or TradingView Premium-they get 10-50ms updates.
How Depth Affects Your Trading Strategy
If you’re a day trader, depth changes everything.
- Entry timing: Wait for a deep bid wall to form before buying. That’s where price will likely bounce.
- Exit strategy: If you’re holding and see a tall ask wall forming above, don’t wait for a breakout. Sell before it gets hit.
- Slippage control: Never use market orders on low-depth coins. Use limit orders. Set them at the edge of the depth wall.
Reddit user u/CryptoDepthMaster reduced slippage by 28% by setting alerts for buy-sell imbalances over 3:1 within 0.5% of price. That’s not luck-it’s strategy.
On the flip side, user TradingNewbie2025 lost money twice because they trusted depth on a low-volume altcoin. The “deep” bids vanished right before their order executed. That’s the danger of ignoring volume and depth together.
Tools That Actually Help
You don’t need fancy software to start. But you do need the right ones.
- Free: CoinGlass and Binance’s native depth chart give you 1% depth with 500ms refresh. Good enough for beginners.
- Mid-tier: TradingView Premium ($14.95/month) adds heatmaps, volume profiles, and depth alerts. Worth it if you trade daily.
- Professional: Bookmap Pro ($99/month) shows real-time order flow with 10ms updates. Used by hedge funds and market makers.
Don’t waste money on tools that don’t update fast enough. If your depth chart updates every second, you’re trading with your eyes closed.
Limitations You Can’t Ignore
Depth isn’t magic. It has blind spots.
- Dark pools: Institutions trade in private venues. Their orders don’t show up on public order books. If 40% of Bitcoin’s liquidity is hidden, depth charts only show 60%.
- Flash crashes: During the March 2020 crash, order books became useless for 22 minutes. Liquidity evaporated faster than data could update.
- Aggregated data errors: Some platforms pull depth from 15 exchanges. Amberdata found 18-22% discrepancies during volatility. Your depth might be wrong.
Depth tells you what’s visible. It doesn’t tell you what’s coming. That’s why you combine it with volume, on-chain data, and news.
What Experts Say
Dr. David Weisberger, CEO of CoinRoutes, says 83% of institutional crypto traders use depth daily. Fidelity Digital Assets reports 100% of their clients rely on it. That’s not a coincidence.
But even experts warn: depth alone isn’t enough. CME Group’s 2022 report says, "Order book depth in isolation is not the correct method to gauge liquidity." You need to pair it with fill quality and price impact. A deep book with wide spreads? Still risky. A shallow book with tight spreads? Might be more liquid than it looks.
Professor Darrell Duffie from Stanford adds: "If dark pools control more than 40% of liquidity, public depth becomes misleading." That’s why institutional traders use internal tools that combine public depth with private order flow.
Where This Is Headed
By 2027, Gartner predicts 95% of trading platforms will have depth visualization built in. That’s how essential it’s become.
Platforms are now adding AI to filter spoofing. CoinGlass’s 2025 roadmap includes machine learning that flags orders disappearing in under 800ms. Glassnode is linking depth with wallet movements-so you can see if whales are moving coins into exchanges before big trades.
But here’s the catch: as regulation tightens (like the SEC’s 2024 rules against spoofing), exchanges are forced to clean up their data. That means depth charts will get more accurate-but also less useful for retail traders who relied on manipulation.
Bottom line: depth isn’t going away. It’s getting smarter. If you ignore it, you’re trading blindfolded. If you learn it, you’re trading with eyes wide open.
What does order book depth tell me that price doesn't?
Price shows you where the last trade happened. Order book depth shows you what’s waiting to trade next. It reveals how much buying or selling pressure is building up at specific price levels. If price rises but depth shows no buy orders below, the move is fragile. If price drops but there’s a wall of bids, it’s likely to bounce. Depth gives you context behind the price.
Is deeper order book always better?
Generally, yes. A deep order book means large trades won’t spike the price. It also means less slippage and tighter spreads. But depth alone doesn’t guarantee liquidity. If the depth is all on one side (say, 10,000 BTC in bids but only 50 BTC in asks), the market is unbalanced and could reverse suddenly. True liquidity means volume on both sides, evenly distributed.
Why do some order books look fake?
Some traders place large orders to trick others into thinking there’s strong demand or supply-then cancel them. This is called spoofing. Fake orders often appear as single, perfectly placed walls (like 500 BTC at exactly $69,999.99). Real depth is messy: it’s spread across multiple price levels, with smaller, irregular chunks. If an order vanishes the moment you try to trade, it’s likely spoofed.
How do I use depth for swing trading?
Swing traders should look for areas where depth has been consistent over hours. If the same $69,500 bid wall holds for 3+ hours, it’s likely a strong support level. Wait for price to test it, then enter long with a stop below. Similarly, if sell pressure builds at $70,500 over multiple tests, that’s a resistance zone. Depth helps you find these zones before price gets there.
Do I need a paid tool to use depth effectively?
No-but you’ll be at a disadvantage. Free tools like CoinGlass or Binance’s depth chart work fine for beginners. But if you’re trading more than $10,000 per day, you need faster refresh rates (under 100ms) and heatmaps to spot concentration. TradingView Premium or Bookmap Pro cut through noise and show you real order flow. For serious traders, the $15-$100/month cost pays for itself in better entries and less slippage.
Michael Teague
March 2, 2026 AT 09:46Bro just use limit orders. Why make it harder? I see people overcomplicating this like it's rocket science. Market orders are for noobs who don't check depth. Done.
Stop losing money over slippage. It's not magic. It's math.
kati simpson
March 4, 2026 AT 08:45i just look at the green and red bars and if one side is way taller than the other i wait a bit
it's not that hard honestly
you don't need to be a genius to see that a 500 btc bid at exactly 69999.99 is probably fake
real people don't place orders like that
they spread it out
like real life
not some perfect math equation
Cory Derby
March 5, 2026 AT 04:13Thank you for this clear and thoughtful breakdown. I appreciate how you emphasized that liquidity is not about price movement but about the structural integrity of the order book.
For those new to this, I want to gently reinforce: depth is not a predictive tool-it is a diagnostic one. It reveals the current state of market consensus, not future intent.
Understanding the difference between visible liquidity and hidden liquidity (like dark pools) is critical. A deep order book on a public exchange does not equate to market-wide liquidity.
Also, please note that spoofing is not merely unethical-it is a structural vulnerability that undermines trust in the entire system.
When you see a wall of bids that vanishes the moment you move your cursor, you are not seeing a market-you are seeing a performance.
Always cross-reference with volume profiles and time-and-sales data. Depth alone is like reading a book with half the pages missing.
Mary Scott
March 6, 2026 AT 19:28Shannon Holliday
March 7, 2026 AT 20:18Yesss this is sooo true!! 🙌
Depth is everything 🤯
I used to lose so much on market orders until I started checking the wall 🤫
Now I just wait for the green wall to grow 👀
Love this post!! 💖
Jeremy buttoncollector
March 9, 2026 AT 03:23Depth is merely the epiphenomenon of ontological liquidity gradients manifesting through distributed consensus mechanisms.
When you observe a bid wall, you're not seeing volume-you're witnessing a topological anomaly in the price-action manifold.
The market is not a ledger. It's a Hilbert space of probabilistic intent.
Slippage? That's just the decoherence of quantum order flow collapsing under the weight of classical execution.
Use Bookmap. Or don't. But know that your intuition is a flawed classical approximation of a non-Euclidean trading landscape.
Michelle Xu
March 10, 2026 AT 15:50Excellent summary. I’d like to add one practical tip: when you’re swing trading, don’t just look at depth at the current price. Look at the depth profile from the last 24 hours.
Use the 1% depth chart on TradingView and overlay it with volume. If you see a consistent level of buy pressure forming over several hours-say, between $69,400 and $69,600-that’s not random. That’s institutional accumulation.
And if you’re using a free platform with 1-second refresh, you’re seeing ghost data. The market moves faster than your screen updates.
Start with CoinGlass. Upgrade when you’re trading over $5k per day. The cost is negligible compared to one bad slippage.
Ryan Burk
March 10, 2026 AT 17:29lol you think depth matters?
every exchange is rigged.
the bots run the order books.
they fake the walls.
they bait retail with fake liquidity.
you think you're reading depth?
you're reading a lie.
the only thing that matters is onchain.
if a whale moves coins to binance? that's your signal.
not some pretty chart.
your depth chart is a cartoon.
get real.
Sriharsha Majety
March 12, 2026 AT 11:20maybe you guys overthink this
Tabitha Davis
March 13, 2026 AT 09:50OH MY GOD I KNEW IT
THEY'RE ALL FAKE
THEY'RE USING AI TO MANIPULATE THE DEPTH CHARTS
I SAW A 1000 BTC BID AT 69999.99 AND THEN IT VANISHED AND THEN BITCOIN DROPPED 8%
IT WAS A TRAP
THEY WANT US TO LOSE
THEY'RE WORKING WITH THE EXCHANGES
THEY'RE USING DARK POOLS TO FLOOD THE MARKET
THEY'RE USING QUANTUM COMPUTERS TO PREDICT OUR ORDERS
AND THE FED IS IN ON IT
YOU THINK YOU'RE SMART? YOU'RE BEING PLAYED
I'VE BEEN DOING THIS SINCE 2017 AND I KNOW THE TRUTH
DEEP STATE CRYPTO
John Fuller
March 15, 2026 AT 06:41Lucy Simmonds
March 17, 2026 AT 03:22you say depth matters but what about when the exchange gets hacked?
what about when the data feed is delayed?
what about when the server crashes and your chart shows 500 btc buy wall but there's actually 5 btc?
you're trusting a screen that could be lying to you
and you call this investing?
you're not trading
you're gambling on a glitch
Maggie House
March 17, 2026 AT 10:51This was so helpful thank you!! 😊
I just started trading and was so confused about why my orders kept getting filled at worse prices.
Now I check the depth chart before every trade and it's made such a difference.
Also I love that you mentioned the 3:1 imbalance tip-that’s a game changer!
Keep sharing this stuff 💪❤️
Dana Sikand
March 19, 2026 AT 04:38DEEP ORDER BOOK = PEACE OF MIND
I used to panic every time price dipped
now I look at the depth
if there's a solid wall of bids below me? I relax
if the wall is thin? I wait
it's not about predicting
it's about not being surprised
you're not a fortune teller
you're a detective
and the depth chart? it's your evidence
Cameron Pearce Macfarlane
March 20, 2026 AT 12:28all this depth talk is just noise
price moves on volume
not some pretty bars
if you're relying on depth you're already losing
the market doesn't care about your chart
it cares about money
and the big players don't leave their orders visible
they move it silently
you're chasing ghosts
Elizabeth Smith
March 22, 2026 AT 03:02There is a moral dimension to order book depth that is rarely discussed.
When we trade based on visible liquidity, we are participating in a system that rewards transparency.
When we ignore depth, we become complicit in a culture of ignorance.
Every market order placed without checking depth is a vote against awareness.
Every trader who trusts a 1-second chart is surrendering their autonomy to latency.
Depth is not a tool.
It is a responsibility.
Robert Kromberg
March 23, 2026 AT 15:57I appreciate the depth of this post.
It’s rare to see someone explain liquidity without turning it into a sales pitch for expensive software.
I’ve found that even with free tools, if you wait 10-15 seconds after a big price move and check the depth again, you’ll often see what’s really there.
Most fake orders vanish within 5 seconds.
So patience beats speed.
And always, always-trade with a stop loss. No chart changes that.
Ifeanyi Uche
March 24, 2026 AT 17:31you think depth is the answer?
in nigeria we trade on p2p
no depth charts
no bots
just people
and still we make money
your american charts are a distraction
real trading is about trust
not bars on a screen
you overthink everything
Kenneth Genodiala
March 26, 2026 AT 00:50One must ask: is the order book a reflection of market sentiment-or merely a mirror constructed by algorithmic actors to extract behavioral data from retail participants?
The depth chart, in its current form, is a performative artifact of a hyper-optimized, post-liquidity economy.
It does not reveal truth.
It reveals the illusion of truth.
And those who worship at the altar of the 1% depth profile are merely consumers of a commodified epistemology.
Michael Rozputniy
March 27, 2026 AT 00:47the government controls the order book data feed
they alter the timestamps
they delay the updates
they inject fake volume
you think you're seeing liquidity?
you're seeing a government simulation
they want you to trade
they want you to lose
they want your data
and your money
depth charts are just the bait
Danny Kim
March 28, 2026 AT 00:43so you're telling me that if i see a 1000 btc bid at $69,999.99 and it disappears when i move my mouse...
that's spoofing?
wow.
who knew?
next you'll tell me the sun rises in the east.
Cathy Sunshine
March 28, 2026 AT 12:56you say depth matters?
what about the 2021 crypto crash?
the order book was full of bids.
then it vanished.
in 12 seconds.
every single one.
that's not liquidity.
that's a massacre.
depth is a lie.
price is the only truth.
everything else is theater.